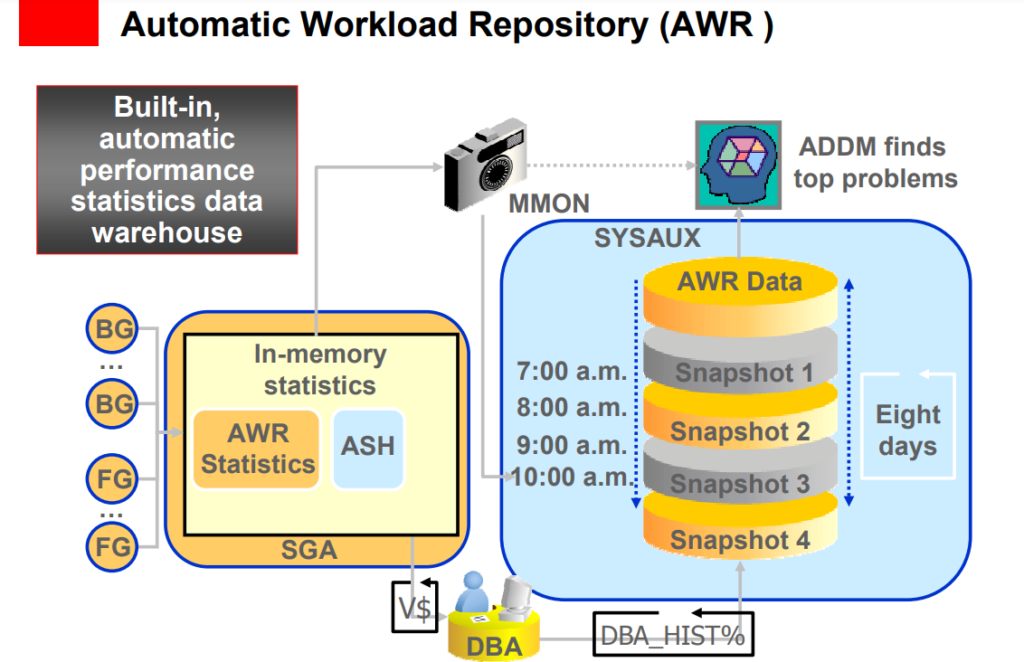
Automatic Workload Repository (AWR) is a licensed feature that allows information to be recorded on a database for multiple purposes including detection and elimination of performance issues.
AWR reports are an extremely useful diagnostic tool for the determination of the potential cause of database wide performance issues.
Typically when a performance issue is detected, you would collect an AWR report covering the period of the poor performance. It is best to use a reporting period no longer than 1 hour as otherwise specifics can be lost.
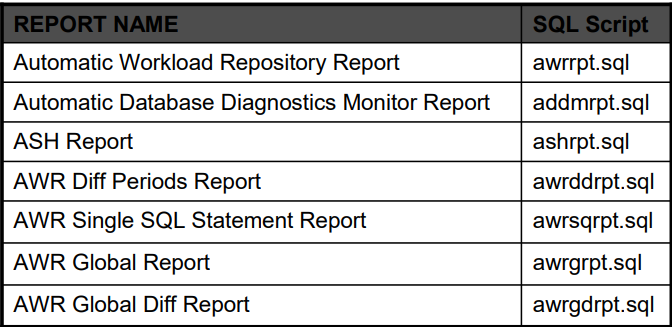
Automated Workload Repository (AWR) report (awrrpt.sql), which is very similar to the STATSPACK elapsed-time report. The AWR elapsed-time report (awrrpt.sql)contains valuable information regarding the health of the Oracle instance, but considerable skill is required to fully understand and interpret each section.

• DB Time
– Total time in database calls by foreground sessions
– Includes CPU time, IO time and non-idle wait time
– DB Time <> response time
– Total DB time = sum of DB time for all active sessions

Goal: To Reduce Total DB time
• Active Session
– Session currently spending time in a database call, i.e., accruing DB time
• Average Active Sessions = DB Time/ Elapsed Time
• Average Active Sessions is a key metric for measuring DB load
• Snapshots – DBA_HIST_SNAPSHOT
• Tracks Snapshots in the AWR
• Time Model – v$sys_time_model => dba_hist_sys_time_model
– DB Time
– Automatic Tracking of Operation Times
• Overall parse time (hard, soft, failed,..)
• SQL, PLSQL and Java overall execution times
• Wait Model – v$system_event => dba_hist_system_event
– Wait Events Categorized Based On Solution Area
– More than 900 different wait events. 12 wait classes (Application, Concurrency)
• SQL statement statistics – v$sqlstats => dba_hist_sqlstat
– Resource Usage: Executions, Physical Reads, Physical Writes
– Efficient Top SQL identification using deltas in the kernel
• OS Stats – v$osstat => dba_hist_osstat
– CPU + Memory
AWR Reporting Resources
• Available in
– Enterprise Manager
– $ORACLE_HOME/rdbms/admin
How to create AWR report?
1) AWR report
Run script $ORACLE_HOME/rdbms/admin/awrrpt.sql
2) AWR difference report
Run script @$ORACLE_HOME/rdbms/admin/awrddrpt.sql
3) ADDM report
Run script @$ORACLE_HOME/rdbms/admin/addmrpt.sql
4) AWR SQL report
Connect as sysdba, run script @$ORACLE_HOME/rdbms/admin/awrsqrpt.sql
5) AWR info report
Run script @$ORACLE_HOME/rdbms/admin/awrinfo.sql, AWR Information like current Usage and Data Distribution

Comparative Performance Analysis with AWR Baselines

• AWR Baseline contains a set of AWR snapshots for an “interesting or reference” period of time
• Baseline are key for performance tuning to
– guide set alert thresholds
– monitor performance
– compare advisor reports
• User-specifiable, schedulable, e.g.:
– last Thanksgiving period
– every Monday 10am-noon for 4 Mondays
• Automatically captures 8-day moving window baseline for week to week comparisons (default)
How to Install/Enable
If we want to save every second ASH data to disk, set “_ash_disk_filter_ratio”=1.
By default, it save 1 second snapshot out of 10 seconds.

If we want to set AWR snapshot interval to 15 minutes, by default it’s 60 minutes: exec DBMS_WORKLOAD_REPOSITORY.MODIFY_SNAPSHOT_SETTINGS(interval=>15);

If we want to set AWR data retention time to 90 days, by default it’s 7 days:
exec DBMS_WORKLOAD_REPOSITORY.MODIFY_SNAPSHOT_SETTINGS(retention=>90*1440);
How to Disable
Download the file dbmsnoawr.plb from Oracle DOC [ID 436386.1], and run follow Steps:
@dbmsnoawr.plb
exec dbms_awr.disable_awr();
In case of STATISTICS_LEVEL is TYPICAL, set “_ASH_ENABLE”=FALSE to disable ASH, and run package in below document to disable AWR: Package for disabling AWR without a Diagnostic Pack license in Oracle [ID 436386.1]
select min(snaP_id),max(snap_id) from DBA_HIST_SNAPSHOT ;
BEGIN
  dbms_workload_repository.drop_snapshot_range(low_snap_id => &lowid, high_snap_id=> &highid);
END;
/
Recreate the AWR repository:
SQL> connect / as sysdba
SQL> alter system set statistics_level=basic;
SQL> @?/rdbms/admin/catnoawr.sql
SQL> @?/rdbms/admin/catawrtb.sql
SQL> alter system set statistics_level=typical;
Useful SQL to query AWR data
1) Top CPU consuming Session in last 5 minutes
SELECT session_id,
       COUNT(*)
FROM   v$active_session_history
WHERE  session_state = 'ON CPU'
       AND sample_time > sysdate - ( 5 / ( 24 * 60 ) )
GROUP  BY session_id
ORDER  BY COUNT(*) DESC;
2) Top Waiting Session in last 5 minutes
SELECT session_id,
       COUNT(*)
FROM   v$active_session_history
WHERE  session_state = 'WAITING'
       AND sample_time > sysdate - ( 5 / ( 24 * 60 ) )
GROUP  BY session_id
ORDER  BY COUNT(*) DESC;
3) Top Waiting Event in last 5 minutes
SELECT event,
       COUNT(*)
FROM   v$active_session_history
WHERE  session_state = 'WAITING'
       AND sample_time > sysdate - ( 5 / ( 24 * 60 ) )
GROUP  BY event
ORDER  BY COUNT(*) DESC;
4) Top Active Machine in last 5 minutes
SELECT machine,
       COUNT(*)
FROM   v$active_session_history
WHERE sample_time > sysdate - ( 5 / ( 24 * 60 ) )
GROUP  BY machine
ORDER  BY COUNT(*) DESC;
5) Top SESSION by CPU usage, wait time and IO time in last 5 minutes
select
ash.session_id,
ash.session_serial#,
ash.user_id,
ash.program,
sum(decode(ash.session_state,'ON CPU',1,0)) "CPU",
sum(decode(ash.session_state,'WAITING',1,0)) -
sum(decode(ash.session_state,'WAITING',
decode(en.wait_class,'User I/O',1, 0 ), 0)) "WAITING" ,
sum(decode(ash.session_state,'WAITING',
decode(en.wait_class,'User I/O',1, 0 ), 0)) "IO" ,
sum(decode(session_state,'ON CPU',1,1)) "TOTAL"
from v$active_session_history ash,
v$event_name en
where en.event# = ash.event# AND SAMPLE_TIME >  SYSDATE - (5/(24*60))
group by session_id,user_id,session_serial#,program
order by sum(decode(session_state,'ON CPU',1,0));
6) Top SQL by CPU usage, wait time and IO time in last 5 minutes
SELECT ash.sql_id,
       SUM(DECODE(ash.session_state, 'ON CPU', 1, 0))        "CPU",
       SUM(DECODE(ash.session_state, 'WAITING', 1, 0))
               - SUM( DECODE(ash.session_state, 'WAITING', DECODE(en.wait_class, 'User I/O', 1, 0), 0)) "WAIT",
       SUM(DECODE(ash.session_state, 'WAITING',  DECODE(en.wait_class, 'User I/O', 1, 0),  0))        "IO",
       SUM(DECODE(ash.session_state, 'ON CPU', 1,   1))       "TOTAL"
FROM   v$active_session_history ash,
       v$event_name en
WHERE  sql_id IS NOT NULL AND SAMPLE_TIME >  SYSDATE - (5/(24*60))
       AND en.event# = ash.event#
GROUP  BY sql_id
ORDER  BY SUM(DECODE(session_state, 'ON CPU', 1, 0)) DESC;

Very useful information about AWR.